1
2
3
4
5
6
7
8
9
10
11
12
13
14
15
16
17
18
19
20
21
22
23
24
25
26
27
28
29
30
31
32
33
34
35
36
37
38
39
40
41
42
43
44
45
46
47
48
49
50
51
52
53
54
55
56
57
58
59
60
61
62
63
64
65
66
67
68
69
70
71
72
73
74
75
76
77
78
79
80
81
82
83
84
85
86
87
88
89
90
91
92
93
94
95
96
97
98
99
100
101
102
103
104
105
106
107
108
109
110
111
112
113
114
115
116
117
118
119
120
121
122
123
124
125
126
127
128
129
130
131
132
133
134
135
136
137
138
139
140
141
142
143
144
145
146
147
148
149
150
151
152
153
154
155
156
157
158
159
160
161
162
163
164
165
166
167
168
169
170
171
172
173
174
175
176
177
178
179
180
181
182
183
184
185
186
187
188
189
190
191
192
193
194
195
196
197
198
199
200
201
202
203
204
205
206
207
208
209
210
211
212
213
214
215
216
217
218
219
220
221
222
223
224
225
226
227
228
229
230
231
232
233
234
235
236
237
238
239
240
241
242
243
244
245
246
247
248
249
250
251
252
253
254
255
256
257
258
259
260
261
262
263
264
265
266
267
268
269
270
271
272
273
274
275
276
277
278
279
280
281
282
283
284
285
286
287
288
289
290
291
292
293
294
295
296
297
298
299
300
301
302
303
304
305
306
307
308
309
310
311
312
313
314
315
316
317
318
319
320
321
322
323
324
| <html>
<head>
<title>DeviceOrientationEvent</title>
<meta charset="UTF-8" />
<script src="https://libs.baidu.com/jquery/2.0.0/jquery.min.js"></script>
<script src="https://img.hcharts.cn/highcharts/highcharts.js"></script>
<script src="https://img.hcharts.cn/highcharts/modules/exporting.js"></script>
<script src="https://img.hcharts.cn/highcharts-plugins/highcharts-zh_CN.js"></script>
</head>
<body>
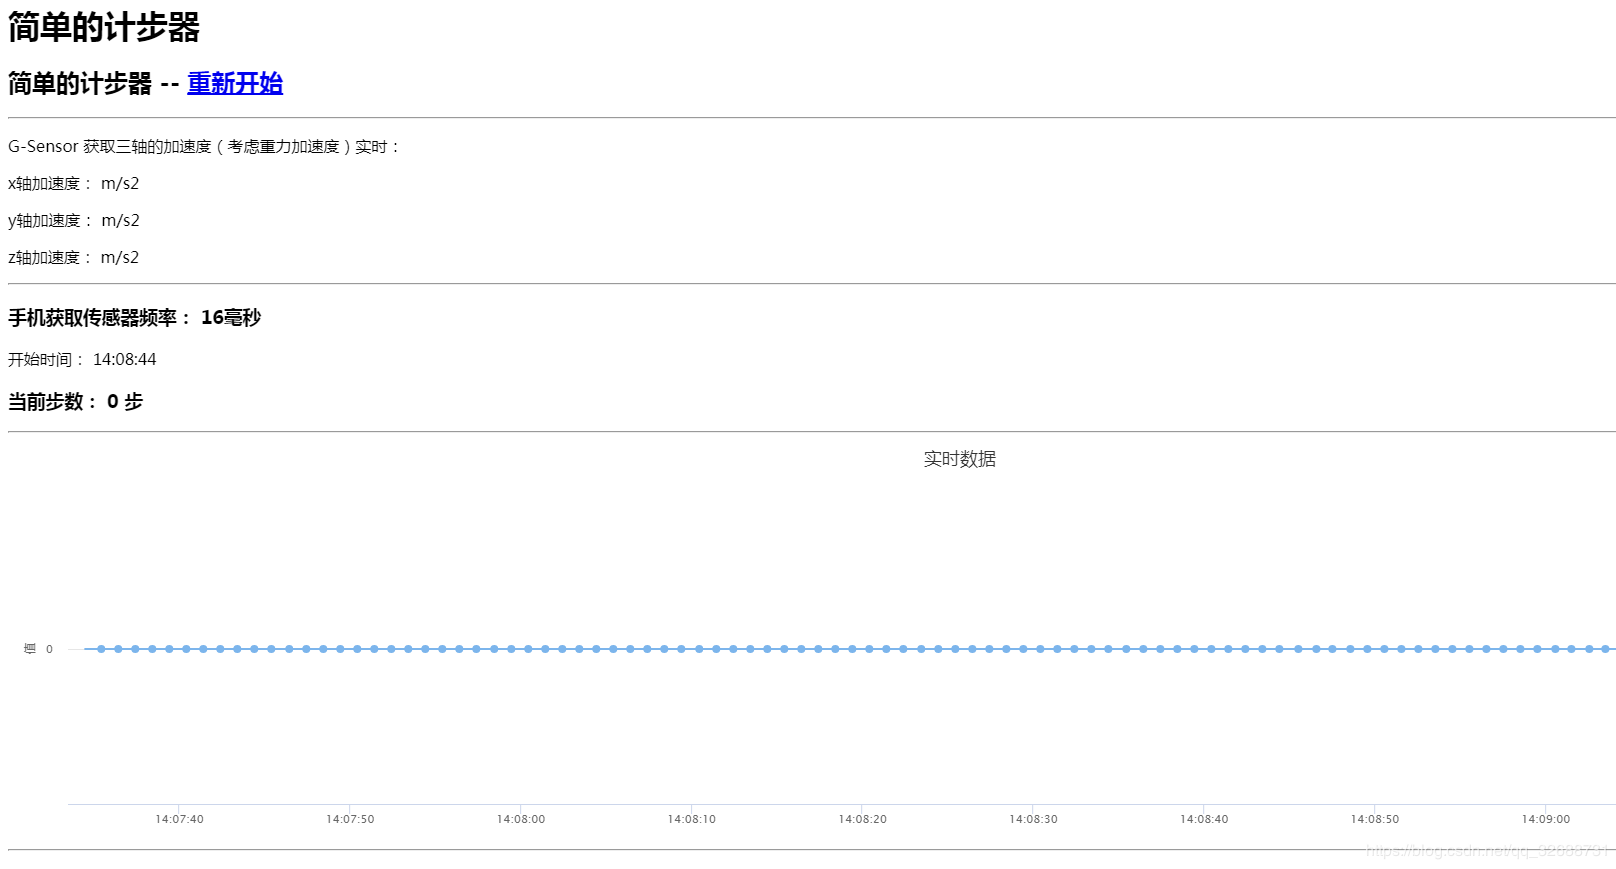
<h1>简单的计步器</h1>
<h2>简单的计步器 --
<a href="demo1.html">重新开始</a>
</h2>
<hr />
<p>G-Sensor 获取三轴的加速度(考虑重力加速度)实时:</p>
<p>x轴加速度:
<span id="xg">0</span> m/s2
</p>
<p>y轴加速度:
<span id="yg">0</span> m/s2
</p>
<p>z轴加速度:
<span id="zg">0</span> m/s2
</p>
<hr />
<h3>手机获取传感器频率:
<span id="interval">0</span>毫秒
</h3>
<p>开始时间:
<span id="date">0</span>
</p>
<h3>当前步数:
<span id="count1"> 0 </span> 步
</h3>
<hr>
<div id="container" style="min-width:400px;height:400px"></div>
<hr>
<script type="text/javascript">
var data = [];//用来记录数据的
var arr = [];//记录△
var status = 0;//是否为开车
var min = 0.5, max = 1.552188;
var temp = {
X: 0, Y: 0, Z: 0
};
var point = 0;
data.push(temp);
//获取传感器上加速器的数据
var count = 0;
function motionHandler(event) {
//html 的addEventListener 变化频率大概1秒60次 ,现在一秒钟收集一次数据
// if (count >= 15) {
document.getElementById("interval").innerHTML = event.interval;
var accGravity = event.accelerationIncludingGravity;
document.getElementById("xg").innerHTML = accGravity.x;
document.getElementById("yg").innerHTML = accGravity.y;
document.getElementById("zg").innerHTML = accGravity.z;
onSensorChanged(accGravity.x, accGravity.y, accGravity.z);//记录数据
count = 0;
// }
// count++;
}
//存放三轴数据
var oriValues = [];
//当前传感器的值
var gravityNew = 0;
function onSensorChanged(x, y, z) {
oriValues[0] = x;
oriValues[1] = y;
oriValues[2] = z;
gravityNew = Math.sqrt(oriValues[0] * oriValues[0] + oriValues[1] * oriValues[1] + oriValues[2] * oriValues[2]);
point = gravityNew;
detectorNewStep(gravityNew);
}
/*
* 检测步子,并开始计步
* 1.传入sersor中的数据
* 2.如果检测到了波峰,并且符合时间差以及阈值的条件,则判定为1步
* 3.符合时间差条件,波峰波谷差值大于initialValue,则将该差值纳入阈值的计算中
* */
//上次传感器的值
var gravityOld = 0;
//上次波峰的时间
var timeOfLastPeak = 0;
//此次波峰的时间
var timeOfThisPeak = 0;
//波峰波谷时间差
var TimeInterval = 250;
//当前的时间
var timeOfNow = 0;
//波峰值
var peakOfWave = 0;
//初始阈值
var ThreadValue = 2.0;
//动态阈值需要动态的数据,这个值用于这些动态数据的阈值
var InitialValue = 1.3;
var count1 = 0;
function detectorNewStep(values) {
if (gravityOld == 0) {
gravityOld = values;
} else {
if (detectorPeak(values, gravityOld)) {
timeOfLastPeak = timeOfThisPeak;
timeOfNow = Date.now();
// System.currentTimeMillis
if (timeOfNow - timeOfLastPeak >= TimeInterval
&& (peakOfWave - valleyOfWave >= ThreadValue)) {
timeOfThisPeak = timeOfNow;
/*
* 更新界面的处理,不涉及到算法
* 一般在通知更新界面之前,增加下面处理,为了处理无效运动:
* 1.连续记录10才开始计步
* 2.例如记录的9步用户停住超过3秒,则前面的记录失效,下次从头开始
* 3.连续记录了9步用户还在运动,之前的数据才有效
* */
// mStepListeners.countStep();
document.getElementById("count1").innerHTML = count1++;
}
if (timeOfNow - timeOfLastPeak >= TimeInterval
&& (peakOfWave - valleyOfWave >= InitialValue)) {
timeOfThisPeak = timeOfNow;
ThreadValue = peakValleyThread(peakOfWave - valleyOfWave);
}
}
}
gravityOld = values;
}
/*
* 检测波峰
* 以下四个条件判断为波峰:
* 1.目前点为下降的趋势:isDirectionUp为false
* 2.之前的点为上升的趋势:lastStatus为true
* 3.到波峰为止,持续上升大于等于2次
* 4.波峰值大于20
* 记录波谷值
* 1.观察波形图,可以发现在出现步子的地方,波谷的下一个就是波峰,有比较明显的特征以及差值
* 2.所以要记录每次的波谷值,为了和下次的波峰做对比
*
*/
//上一点的状态,上升还是下降
var lastStatus = false;
//是否上升的标志位
var isDirectionUp = false;
//持续上升次数
var continueUpCount = 0;
//上一点的持续上升的次数,为了记录波峰的上升次数
var continueUpFormerCount = 0;
//波谷值
var valleyOfWave = 0;
function detectorPeak(newValue, oldValue) {
lastStatus = isDirectionUp;
if (newValue >= oldValue) {
isDirectionUp = true;
continueUpCount++;
} else {
continueUpFormerCount = continueUpCount;
continueUpCount = 0;
isDirectionUp = false;
}
if (!isDirectionUp && lastStatus
&& (continueUpFormerCount >= 2 || oldValue >= 20)) {
peakOfWave = oldValue;
return true;
} else if (!lastStatus && isDirectionUp) {
valleyOfWave = oldValue;
return false;
} else {
return false;
}
}
/*
* 阈值的计算
* 1.通过波峰波谷的差值计算阈值
* 2.记录4个值,存入tempValue[]数组中
* 3.在将数组传入函数averageValue中计算阈值
* */
//用于存放计算阈值的波峰波谷差值
var ValueNum = 4;
var tempValue = new Array(ValueNum);
var tempCount = 0;
function peakValleyThread(value) {
var tempThread = ThreadValue;
if (tempCount < ValueNum) {
tempValue[tempCount] = value;
tempCount++;
} else {
tempThread = averageValue(tempValue, ValueNum);
for (var i = 1; i < ValueNum; i++) {
tempValue[i - 1] = tempValue[i];
}
tempValue[ValueNum - 1] = value;
}
return tempThread;
}
/*
* 梯度化阈值
* 1.计算数组的均值
* 2.通过均值将阈值梯度化在一个范围里
* */
function averageValue(value, n) {
var ave = 0;
for (var i = 0; i < n; i++) {
ave += value[i];
}
ave = ave / ValueNum;
if (ave >= 8)
ave = 4.3;
else if (ave >= 7 && ave < 8)
ave = 3.3;
else if (ave >= 4 && ave < 7)
ave = 2.3;
else if (ave >= 3 && ave < 4)
ave = 2.0;
else {
ave = 1.3;
}
return ave;
}
if (window.DeviceMotionEvent) {
window.addEventListener("devicemotion", motionHandler, false);
} else {
document.body.innerHTML = "What user agent u r using???";
}
//获取时间
function getNowTime() {
var date = new Date();
var Hours = date.getHours() < 10 ? '0' + date.getHours() : date.getHours();
var Minutes = date.getMinutes() < 10 ? '0' + date.getMinutes() : date.getMinutes();
var Seconds = date.getSeconds() < 10 ? '0' + date.getSeconds() : date.getSeconds();
var time = Hours + ':' + Minutes + ':' + Seconds;
return time;
}
document.getElementById("date").innerHTML = getNowTime();
Highcharts.setOptions({
global: {
useUTC: false
}
});
function activeLastPointToolip(chart) {
var points = chart.series[0].points;
chart.tooltip.refresh(points[points.length - 1]);
}
$('#container').highcharts({
chart: {
type: 'spline',
animation: Highcharts.svg,
marginRight: 100,
events: {
load: function () {
var series = this.series[0],
chart = this;
setInterval(function () {
var x = (new Date()).getTime(),
y = point;
series.addPoint([x, y], true, true);
activeLastPointToolip(chart)
}, 1000);
}
}
},
title: {
text: '实时数据'
},
xAxis: {
type: 'datetime',
tickPixelInterval: 150
},
yAxis: {
title: {
text: '值'
},
plotLines: [{
value: 0,
width: 1,
color: '#808080'
}]
},
tooltip: {
formatter: function () {
return '<b>' + this.series.name + '</b><br/>' +
Highcharts.dateFormat('%H:%M:%S', this.x) + '<br/>' +
Highcharts.numberFormat(this.y, 6);
}
},
legend: {
enabled: false
},
exporting: {
enabled: false
},
series: [{
name: '每秒的值',
data: (function () {
var data = [],
time = (new Date()).getTime(),
i;
for (i = -100; i <= 0; i += 1) {
data.push({
x: time + i * 1000,
y: 0
});
}
return data;
}())
}]
}, function (c) {
activeLastPointToolip(c)
});
</script>
</body>
</html>
|